Browse by Solutions
Browse by Solutions
What is Performance chart?
Updated on November 5, 2017 10:22PM by Admin
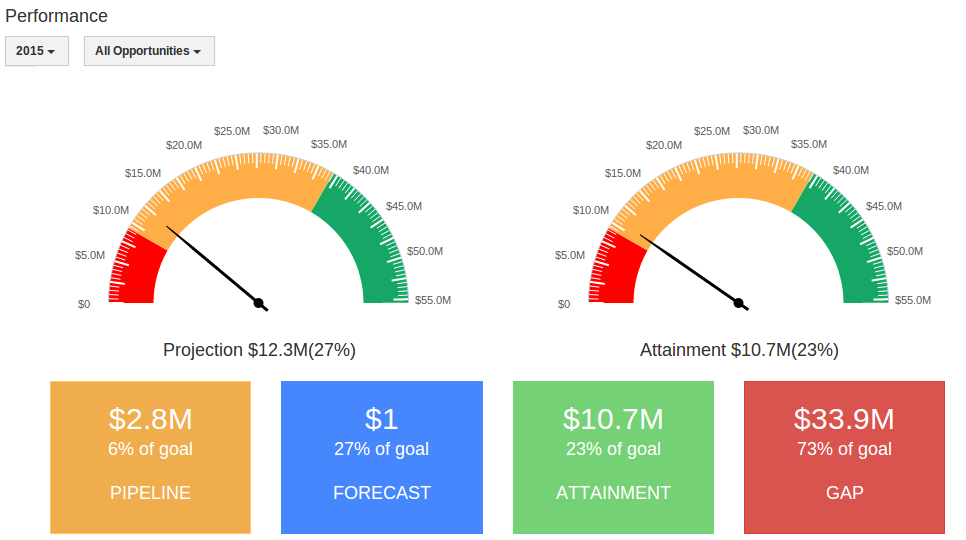
A performance chart showcases team performance as well as individual performance. This chart is tightly integrated with the data found in the Sales Planning App.
How it works?
One graph tracks projected sales and the other tracks attainment.

Projection
Opportunities are sorted according to their sales stage. Each stage may have potential value associated with it to graphically show the probability of a sale.
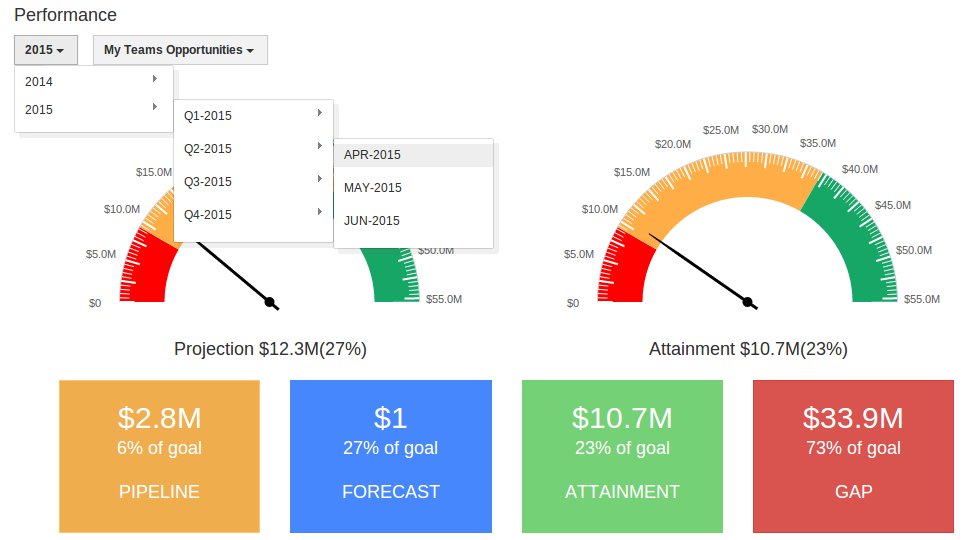
You can also view opportunity performance by "Fiscal year" as shown in the image below:

The Opportunities app allows you to view "Individual" performance charts or your own performance chart as seen in the image below:

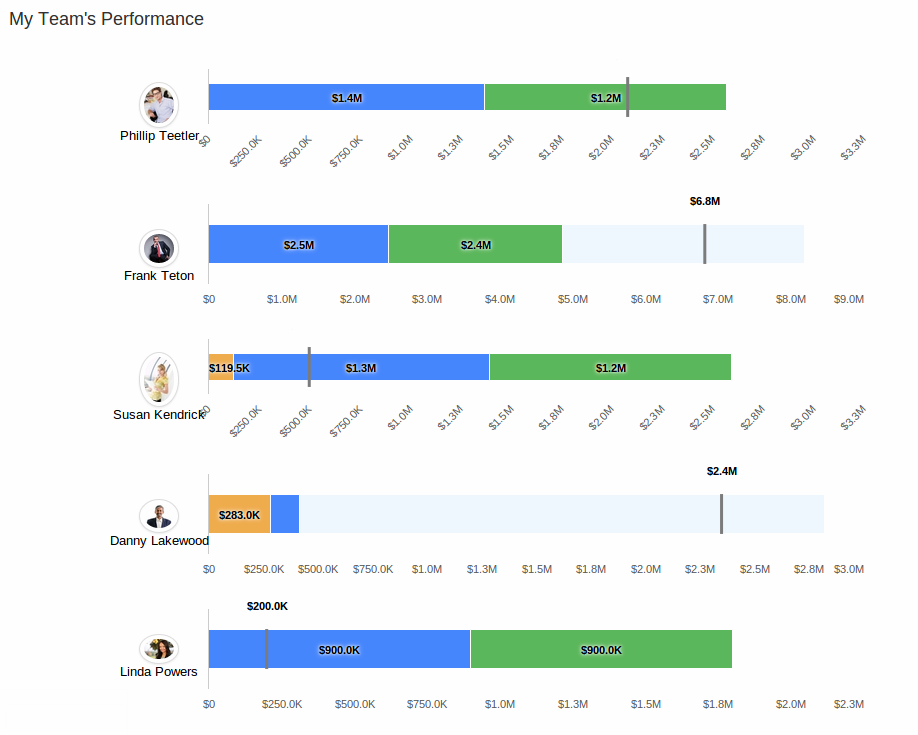
The Opportunities app allows you to view the "My Team" performance chart, as well:

