Calculating the average closure time of cases is a great method to monitor the performance of your employees. The Cases App of Apptivo allows you to not only calculate and monitor the average closure time but also compare the performance using the Summary Table available in the Dashboards.
Let’s go through the process to configure, calculate, and monitor the average closure time.
Steps to calculate the average closure time.
Step 1: Configuring the fields
Before calculating the average closure time, you have to add a field in the Master Layout to pull the value.
Average Closure Time = Date Resolved - Created On
- This is basically the time between the creation and closure of a case. This difference is calculated and displayed using a Function Attribute.
- In the Cases App of Apptivo, go to Settings → Customize App → Master Layout.
- Here, drag and drop a Function attribute from the Palette.
- In the Inspector tab, rename the field as Closure Time and change the Type as Date & Time Formula.
- Scroll down to the Function section and select Create Function.
- The Function Editor window appears. Here, set the formula as Date Resolved - Created On using the Insert Attributes option.
- Select Create and save changes.
Step 2: Automatic End Date Calculation
Now, the fields are added. You have to configure to add the value in the Date Resolved field automatically. This can be set up using the Triggers feature available on the Settings page.
- Switch to Cases → Triggers → Event Based in the left navigation panel of the Settings page.
- Select Create to create a new trigger.
- In the Create Trigger page, add a name for the trigger. In addition to this, you can also set the event during which the action has to occur. Here, Cases Updated.
- To have the trigger in operation, keep the enabled toggle ON.
- In the Criteria section, determine the condition during which the trigger has to occur. Here, the condition is to generate an action when the Status is changed as Closed.
- You can make use of the Actions to set the type of trigger. Since the Date Resolved attribute is to be updated, the action chosen is Update Attribute.
- In the Create Trigger Action side panel, choose the attribute that has to be updated.
- Here, the Date Resolved has to be updated to Now.
- Complete creating the trigger.
- Consider a case is updated as closed.
- The Date Resolved value automatically changes the date and time when the status was changed as closed.
- Simultaneously, the Closure Time is also calculated.
Step 3: Configuring Summary Table
- Now that the function attribute is configured and the trigger is set up, the next step is to create a summary table to display the average closure time.
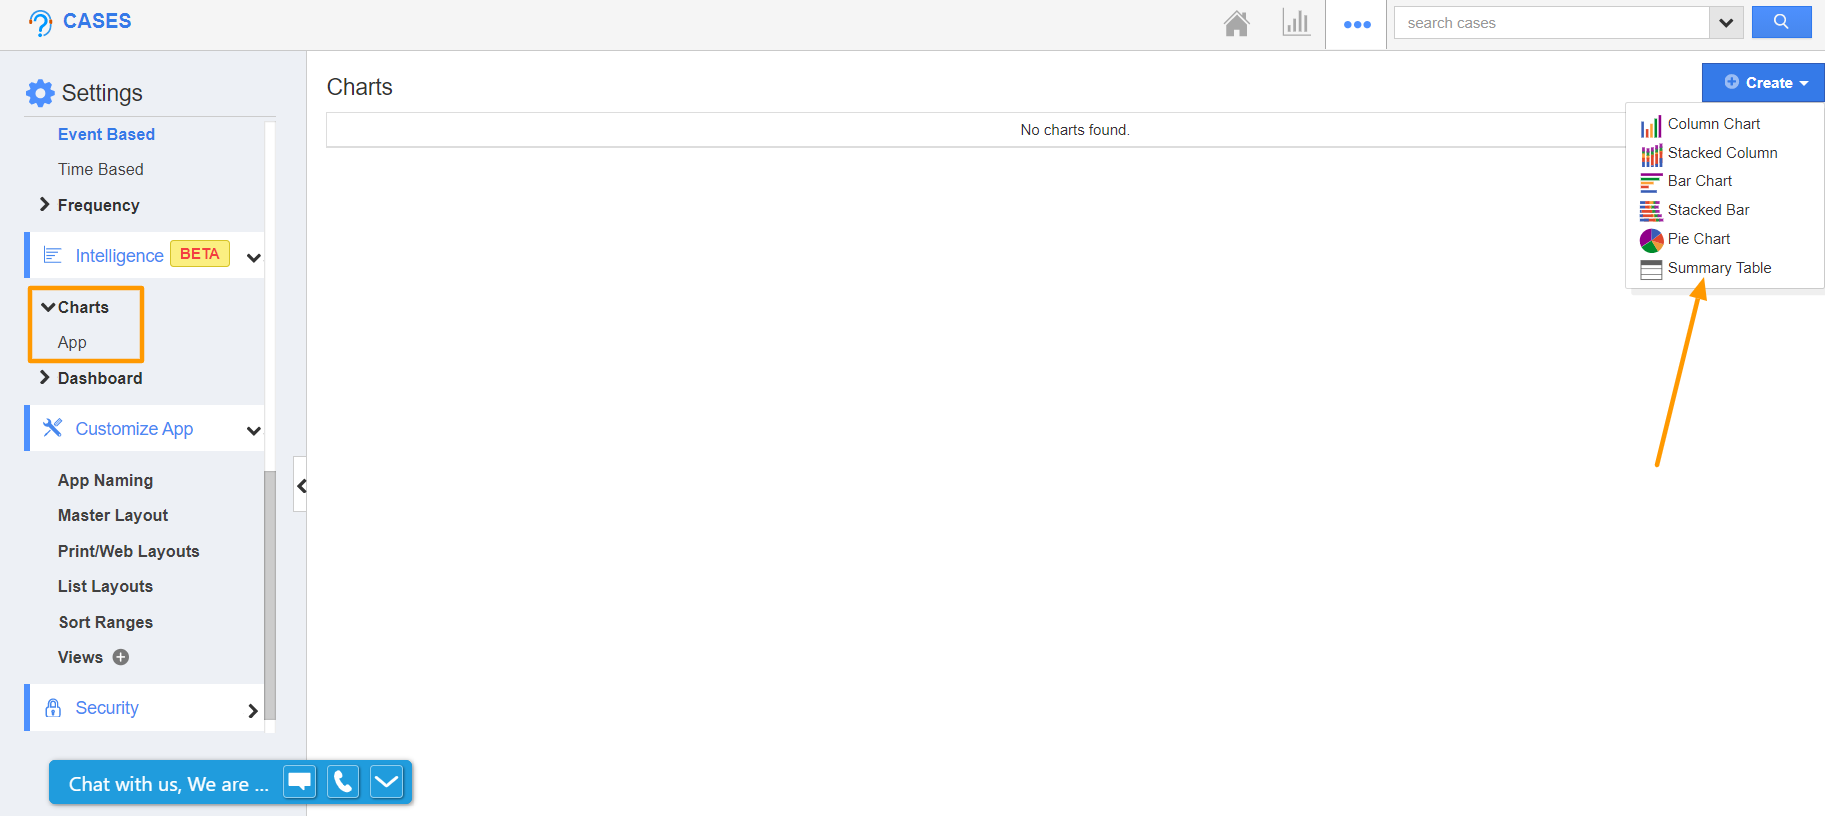
- On the Settings page, click on the Intelligence → Charts → App from the left navigation panel. From the Charts page, click on the Create button and select the Summary Table.
- You will be redirected to the Create Summary Table page.
- Here, enter the name of the Summary Table.
Note: Based on the Privileges selected, the employee will have access to the Summary Table.
- By using the Inspector tab on the right end, you can customize the Summary Table as per your business need.
- You can change the Table Title and the Default Rows of the Summary Table.
- Then, switch to the Context tab to change the Column name and the values of the Summary Table.
- Here, the Context Column is named and chosen to display the Summary of the cases.
- In the Value Column 1, the Aggregation Type is set as Average and the Attribute selected is Closure Time that was configured in the Master Layout.
- You can also more columns by clicking the (+) icon.
- You can add the filter for the Table by enabling the Filter option.
- Then in the Formatting table, you can customize the format of the table.
- You can set the Sorting function as Ascending or Descending order for the Columns.
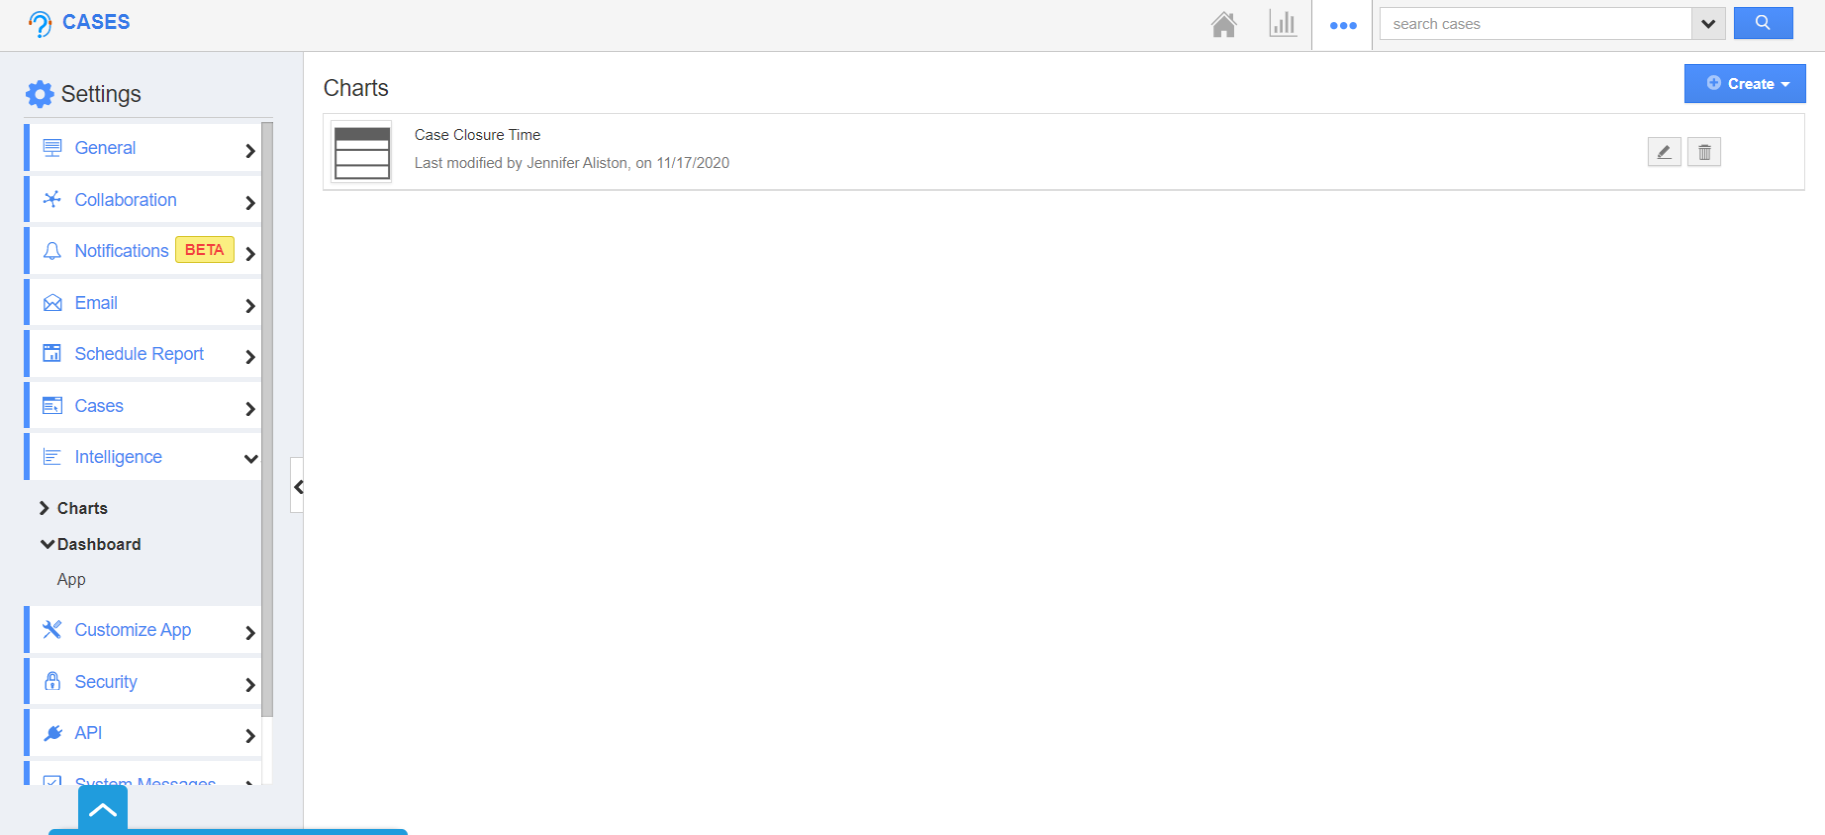
- On selecting Create, a new Summary Table is created.
Step 4: Adding Summary Table in Dashboard
- On the Settings page, click on the Intelligence → Dashboard → App. Click on the Create button.
- You will be redirected to the Create Dashboard page, add the name, description of the dashboard.
- Here, drag and drop a One Column section.
- Using the drag, and drop a section from the Palette tab and select the created Summary Table under the Charts Section.
- Change the Section name in the Inspector Tab.
- Then, click on the create.
- The new dashboard will be created and you can view the created dashboard in the list.
- Now, go to the Dashboards section in the Cases App. Here, select the created dashboard to view the average closure time of the cases.


