|
CRMs have come a long way since their inception. With the help of CRM software, you can completely transform your business functions and head towards higher profits. They help manage customer service, daily activities, accounting and marketing, and numerous other activities.
CRMs today have to deal with mountainous data which is analyzed and displayed in the form of meaningful data sheets, charts, and images. This data can be utilized effectively to predict sales and bring about changes to increase the reach to your customers. These analyses give you invaluable insights into the market and help you adapt to change.
How Does Apptivo’s Reports and Dashboards Help Improve Sales
Apptivo’s Analytics tools are highly customizable. These analytics, when used correctly, can become an integral part of your organization’s functions.
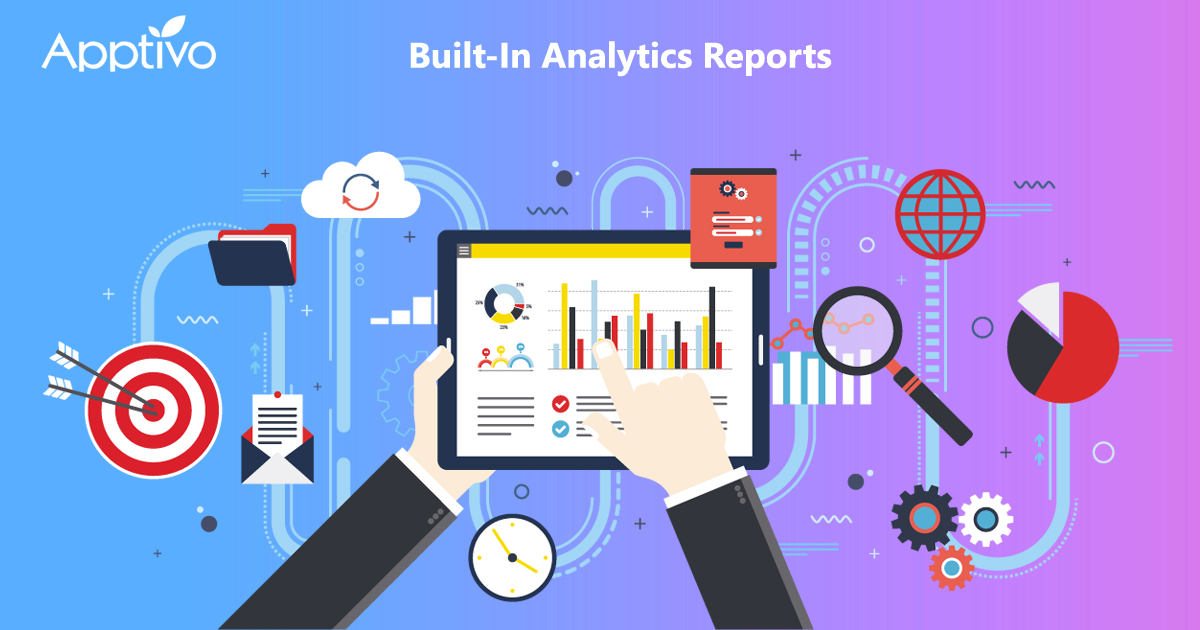
1. Built-In Analytics Reports
|
Apptivo’s Analytics tools provide comprehensive analysis reports about the sales teams’ performances. Large amounts of data are presented in easy-to-understand graphs and pie-charts to quickly identify areas of a lacuna.
-
A. Analyzing Wins And Loses
With the help of Apptivo, team leaders can now find the reasons why the sales representative lost or won a deal. The employee can mark the reasons given by the client for closing a deal or not, to be reviewed later. Opportunities tool from Apptivo gives you the flexibility to directly integrate all prospective deals to the tool, without having to manually enter everything.
-
B. Analyzing Leads
The first step towards making any sale is generating leads. Apptivo tools are storage for all the data that comes from prospective clients so that they may later be converted into opportunities. This data is crucial because it helps you identify the primary and most active methods through which your organization is getting the most hits.
With the reports from each of the Apptivo apps, you can now find the percentage of leads converted, deals made and deals lost. You can easily track the source of those leads, the employee converting those leads, and the type of lead most profitable for your business.
2. Flexible Custom Reports And Views

|
Custom reports are essential to track the performance of each aspect of a business, be it sales or billing. Most of the Apptivo apps come with custom reports features, which are easily downloadable. These reports can also be shared with other members of the team or the organization.
-
A. Standard Reports
Each app comes with a standard report, which displays how the company is functioning in that sector. You can download the reports and tally it with reports from previous months to find the increment percentage. For instance, with the campaign performance report, you can note the date the campaign was begun, the period during which it was active, the number of responses it generated, and profits that the campaign garnered. If you have multiple campaigns running, you can compare each one’s performance with the others.
-
B. Custom Views
The reports generated by each of the Apptivo apps are highly customizable. Instead of having to make multiple searches every time you want to look up a certain category, you can simply add it to the dashboard for future references. You can further segregate each column or row into more specific criteria. Now, your reports will be more comprehensive.
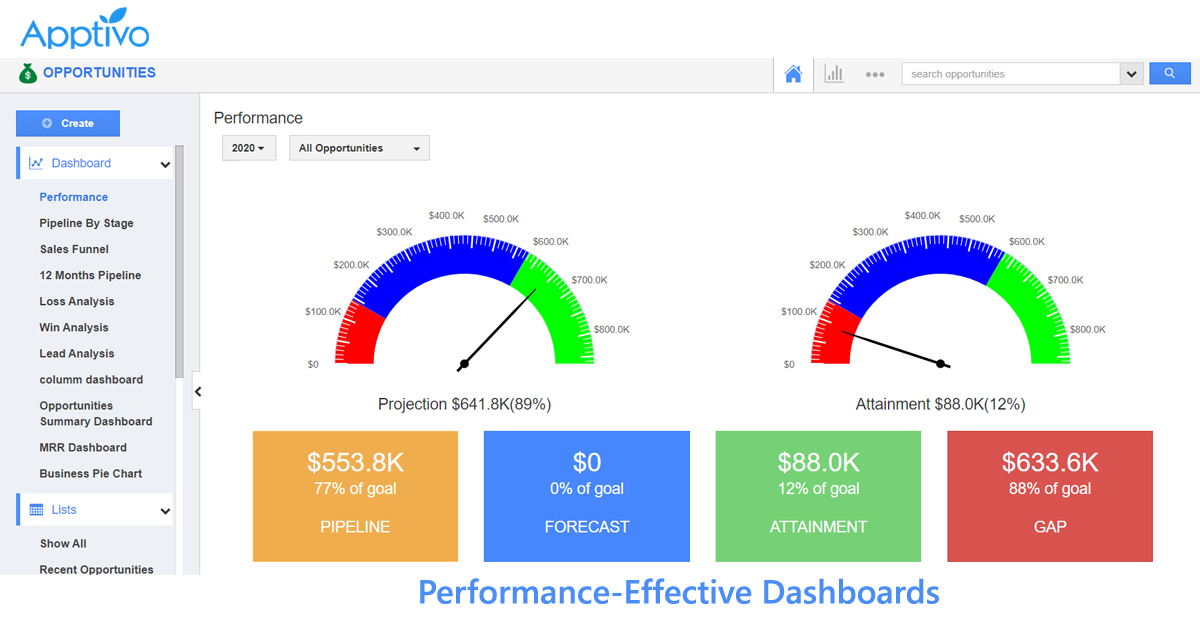
3. Performance-Effective Dashboards
|
Tightly integrated with the Sales Planning app, you will find this analysis highly useful to measure your business’s performance. Each stage of the sales process comes with its own report. The performance is indicated by two charts: Projection and Attainment. While the Projection chart shows how much the expectations or the set goal was, the Attainment chart reveals how much progress has been done.
-
A. Pipeline By Stage
Using Pipeline by Stage, you can make a note of all the opportunities in your sales. This makes it easier for the team manager to set goals and predict expected revenue. It also provides a detailed look into the prospective deals. You can also segregate the report by sales territory, timeline, stage of sales, and revenue.
-
B. Sales Funnel
The Sale Funnel is differentiated into many layers, depending on the sale stage. The funnel demonstrates the number of prospects the organization has in that particular stage of sales. The sales funnel is highly useful because it helps your team visualize the numbers and take more effective action. Using this information, along with the conversion rates for each stage, you can set the appropriate expectation for the month or year.
Final Thoughts
When you regularly check and analyze the data, you are getting one step closer each time to increase your performance. The detailed reviews from each sector of your business are important to figure out the highest performing teams and also those which require more attention.
Using Apptivo’s CRM analytics, you can identify patterns of customer behavior, and take appropriate measures to address issues. Let us help you transform your sales and marketing practices, with our highly customizable reports. Apptivo analytics is your ticket to success.
Latest Blogs

Role Of CRM In Travel And Tourism Industry
Travel and tourism have been a significant part of everyone’s life since the ancient period. When we skim through the pages of history, It should be noted that humans were initially nomads before they became settled in one place. They...
Read more →
WHAT IS CRM TECHNOLOGY?
Introduction CRM is a technology that helps manage the entire customer information and interactions in order to build and maintain superior customer relationships. The CRM solution replaces spreadsheets and other different applications, which makes it easy for the businesses to...
Read more →
Everything you need to know about the Annual Maintenance Contract!
1. What is an Annual Maintenance Contract? 2. Benefits of Maintenance Contracts 3. How can Apptivo CRM help you manage maintenance agreements and vendors? 4. Summary Think about getting the confidence that the machinery is well-maintained and performing optimally, without...
Read more →