As a customer every one of us has probably experienced a frustrating technical problem and wished for expert assistance at some point in our lives. On the other side, businesses receive a huge number of enquiries about the product or service, and find it tough to ensure that every enquiry is answered to the fullest satisfaction of the customer. That’s where help desks play a major role – they provide a lifeline for individuals and organizations struggling with IT problems.
But have you ever wondered how help desks work and how businesses measure its effectiveness and performance?
In this blog post, let’s dive into the world of help desks, exploring their functions and the metrics used to evaluate their effectiveness. This post will reveal the secrets of the help desk world and give you the inside scoop on what makes them tick, whether you’re a tech enthusiast or a business owner.
So buckle up and prepare for an adventure into the fascinating world of help desks!
 |
3. What is a help desk metric?
5. So, how do Help desk metrics differ from KPIs?
A help desk ticket!
In customer service, a ticket is like a golden ticket to Willy Wonka’s Chocolate Factory. It’s a mystical item that allows companies to monitor, handle, and fix customer enquiries, issues, and complaints.
Consider a ticket to be a unique and individual cry for assistance from a customer that must be acknowledged and resolved. It’s like a little information package that includes the customer’s name, contact information, a description of the problem, and how urgent it is. A ticket is essentially a customer’s way of saying, “Hey, I need your help, and here’s what you need to know to assist me.”
Whenever a request is received, it is marked as a ticket and recorded electronically. The system then consolidates all such requests to be organized, reviewed, prioritized, and routed.
With the implementation of helpdesk, agents can respond to common questions with pre-programmed responses and route more difficult queries to the appropriate agents, freeing staff from routine tasks and allowing support agents to focus on more complex ones.
How does a help desk work?
Let’s understand the entire process of a help desk with an example. Take the case of Apollo 13 (a scenario recreated in the famous movie of the same name) where the crew faces a challenge to fit a proverbial square peg in a round hole. The way the ground crew came up with the solution to relay to the astronauts is the way a help desk works. To capture that scenario and the solution presented to the astronauts for future reference is how a help desk works.
It acts as a collective repository of information for use by any individual in the organization to lookup solutions on one side and helps agents to respond to every individual query on the other side. As a system it can provide invaluable insights and connect agents with the right resources and information to provide timely solutions to customers.
What is a help desk metric?
Help desk metrics are those parameters tracked by the companies to track the effectiveness of their help desk. They enable organizations to efficiently modify strategy in order to give better customer assistance by allowing them to track the performance of customer happiness.
What are KPIs?
A help desk KPI (Key Performance Indicators) or service desk KPI are specific indices that are used to benchmark both individual and team performances. Now, there’s always a confusion between KPIs and metrics. Let’s begin with understanding the difference between them.
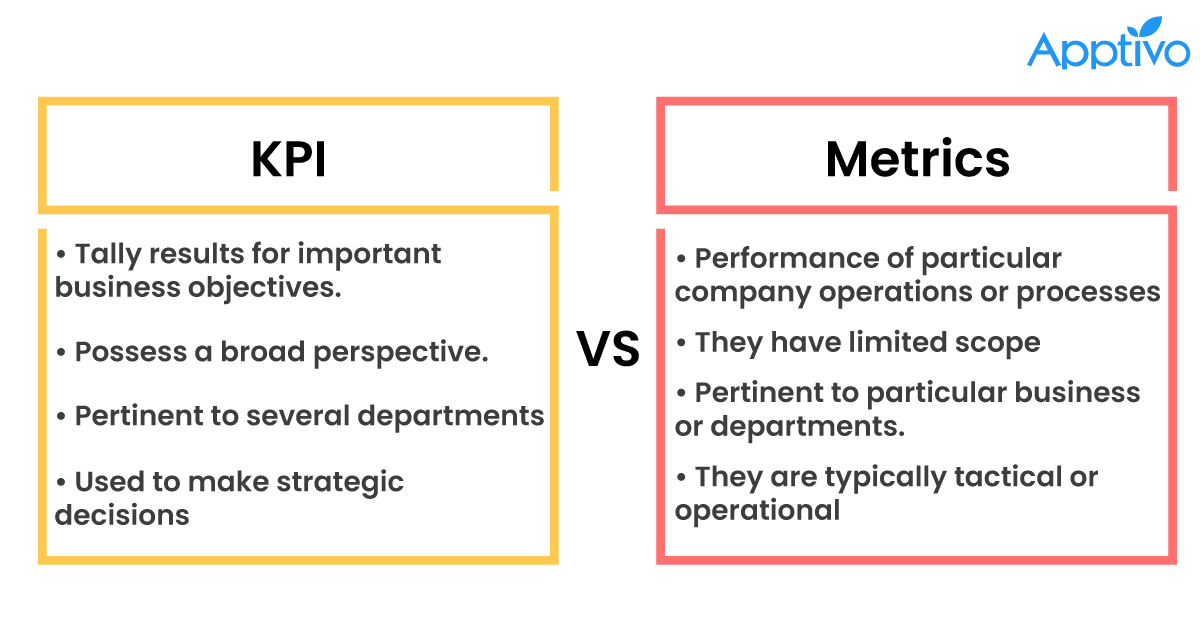
So, how do Help desk metrics differ from KPIs?
In an analogy of a car, a speedometer, odometer, and fuel gauge are individual metrics whereas the Fuel Efficiency measured as Miles Per Gallon is a KPIs.
Although help desk metrics and KPIs are closely related, their objectives and foci are different. Help desk metrics are measurements used to monitor the performance at any given point in time, whereas KPIs are those metrics / derived values that are intended to assess the achievement of a particular business goal.
Some metrics could be – call abandonment rates, ticket volume, typical response time etc. These indicators offer insights as to the current state of the process and as a whole needs to be monitored to optimize delivery of such service/ support.
Some of the KPIs linked to customer satisfaction like Net Promoter Score (NPS), Customer Satisfaction Score (CSAT), Call Resolution Rates etc. These KPIs indicate how well an individual / team has performed over a period of time. They are precise metrics that are tied to a specific business aim and help assess the accomplishment of that target.
 |
KPIs for measuring help desk performance
Don’t measure anything unless the data helps you make a better decision or changes our actions”, as Seth Godin once stated. Although data won’t generate outcomes on its own, it can help businesses interpret consumer behavior and comments to deliver better service more promptly.
SLA compliance rate
SLA rate is a measure of how frequently companies fulfill their promises to customers relating service level commitments. Just like a restaurant promising to deliver an order within 20 minutes or offering it for free, businesses promise to fix technical issues or provide support within a specific timeframe and quality level. It is an important metric for assessing business performance and ability to meet customer expectations.
SLA compliance rate= [(No. of IT incidents resolved in line with SLA compliance) ÷ (Total no. of incidents)]
Agent utilization rate
Agent utilization rate is a key performance indicator that assists managers of help desk teams in ensuring that workload is distributed evenly among agents. Managers can identify areas where agents may need additional training or support by using software to track the number of customers served and the speed with which help desk tickets are resolved. Managers can improve low utilization rates and help agents work more efficiently by providing feedback and training. Finally, monitoring agent utilization rate is an effective strategy for maintaining team morale and providing high-quality customer service.
Agent utilization = [(Total time spent on calls) ÷ (Total time spent on shift)] x 100
Churn rate
Churn rate is the percentage of customers who end their relationship with a brand over a period of time. Metrics such as subscription renewal rate and cancellation rate are examples of how churn rate can be measured. It’s 5 times more costly to acquire new customers than retain existing ones, making churn rate an important metric. Furthermore, selling to an existing customer has a much higher success rate, ranging from 60-70% versus 5-20% for new customers. Businesses can improve their customer experience by monitoring it and focusing on retaining existing customers, which is more profitable.
Churn rate = [(Lost Customers) ÷ (Total Customers at the Start of Time Period)] x 100
Customer satisfaction
Businesses can monitor their customer satisfaction levels by conducting surveys via various channels such as email or phone. These surveys typically ask customers about their help desk experience, including response time, agent knowledge, and issue resolution. Companies can assess their customer satisfaction levels and areas for improvement in their help desk processes by analyzing the survey results.
% of satisfied customers = [(The total no. of 4 and 5 responses) ÷ (No. of total responses)] x 100
Retention rate
Retention rate in helpdesk is a measure of how many customers stick around after they’ve received help. If the help desk has a high retention rate, customers are “sticking like glue” after having a positive experience. They seem to have “discovered their pot of gold” and aren’t planning on leaving anytime soon. Also, an excellent customer service experience improves the likelihood of a repeat purchase by 89%.
Yet, a poor retention rate indicates that clients are “slipping through the fingers”. It is like organizations attempting to grasp a “slippery fish” that just keeps sliding away.
So, if they want to keep their customers around, it’s important to focus on providing excellent help desk support. Because, as the saying goes, “a bird in the hand is worth two in the bush” – it’s better to keep the current customers happy than to try to win over new ones.
Customer Retention Rate= [(Number of customers at the end of a time period – number of new customers gained during the time period) ÷ number of customers at the start of the time period] x 100
Resolution rate
“Closing the loop” is a critical component of any customer support interaction, and it’s no different when it comes to resolution rate in help desk metrics. This focuses on how quickly and well a team can address customer complaints. Businesses can clearly see how their support agents are doing and pinpoint areas for improvement by analyzing the percentage of tickets that are resolved to the customer’s satisfaction. Although “you can’t satisfy everyone,” it’s important to keep in mind that aiming for a high resolution rate is a crucial sign of a successful customer care team. So, keep in mind the proverb “where there’s a will, there’s a way” when discussing resolution rate in help desk metrics.
Overall Resolution Rate= (No. of resolved cases) ÷ (No. of unresolved cases)
Help desk metrics
Poor help desk management can result in significant costs in addition to corporate operations being disrupted. To track and improve the productivity, effectiveness, and performance of the help desk, professionals use a variety of metrics. These data can help executives and IT professionals pinpoint the areas where the help desk excels and those where it needs to improve.
Ticket volume trends/ total conversation
Keeping track of the total number of team conversations over a given time period can provide valuable insights into how to improve the quality of support services. This data can help guide hiring and technology decisions to ensure that customer demands are met. However, keep in mind that not all conversations are created equal, and understanding their nature can help you prioritize them effectively. Are they better suited for self-service or do they require human interaction? Knowing this can aid in the optimization of support services for maximum impact.
Resolution time
Time is money, and time is of the essence in the customer support game. Slow resolution times can sour customer satisfaction and even put a wrench in the works of your entire operation. To provide a smooth and hassle-free experience for their customers, businesses must ensure that they have all of their ducks in a row, with appropriate tools and efficient processes in place. Quick problem-solving is the name of the game, and doing so can earn businesses a pat on the back from their customers as well as a higher CSAT.
Conversations per agent
There is no such thing as a one-size-fits-all approach to customer service. Number of conversations that a support representative can handle is determined by several factors, including industry and experience. Finding the right balance, on the other hand, is critical to ensuring efficient and friendly customer interactions while avoiding team burnout. Businesses can improve team performance by determining the optimal number of conversations for support reps and tailoring their round-robin rules and workflows. This method also allows new reps to learn the ropes without interfering with team dynamics. With this fine-tuned approach to support, businesses can provide excellent service to their customers while maintaining high team morale.
First response time
FRT (First Response Time) is the average time it takes an agent to respond to a customer’s enquiry or support ticket.
The sooner, the better! The speed of a response is a clear indication of the dedication a business has to provide customer satisfaction.
Ideally, customers expect a response time, which is less than 24 hours, and in a live chat the benchmark is expected to be 1.5 minutes and phone 3 minutes.
It is given such importance because it aids in determining how to handle an increase or decrease in ticket volume. This is done to establish a consistent FRT for both the customer and the agent. Brands must understand the efficiency of their agents, as well as the impact of holidays and busy periods on the business in terms of ticket volume.
Furthermore, if tickets are not addressed on time, customers may become frustrated and submit multiple tickets. As a result, even if there is no response, the first thing an agent must do is acknowledge every customer, which greatly improves a brand’s credibility.
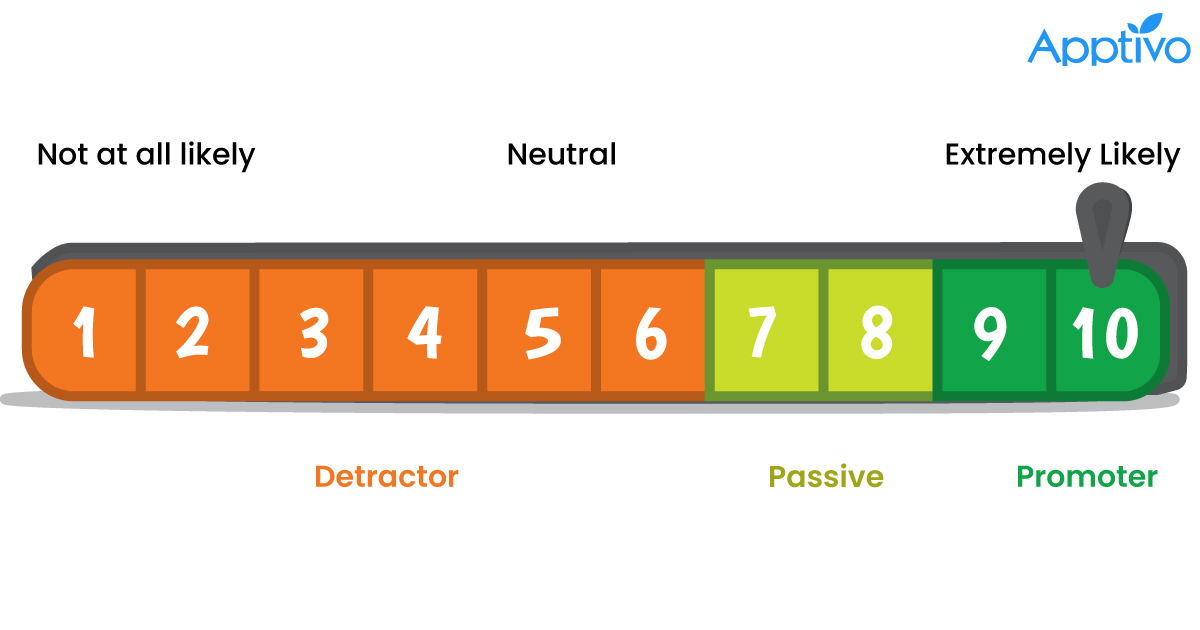
Net promoter score
The NPS is an important tool for determining customer satisfaction. It calculates the likelihood of a customer recommending a company to their friends and family. The percentage of NPS promoters, passives, and detractors is used to calculate the NPS score. This data can assist businesses in better understanding their customers experience and identifying areas for improvement. The NPS is more than a number; it is a valuable asset that can assist businesses in developing long-term relationships with their customers and cultivating a loyal following.
 |
Cost per ticket
Let’s consider a service desk as a money tree that needs constant nurturing and pruning to bear the fruit of customer satisfaction. Cost per ticket is a crucial metric that will help the businesses to evaluate the cost-effectiveness of the support agents and processes. It’s like keeping a hawk’s eye on the finances, knowing exactly where the money is going and how much the company is getting in return. This in turn helps company’s identify and fix any inefficiencies before they snowball into bigger problems, streamlining the processes and maximizing the resources for optimal results.
Tickets by type
As one of the most useful service desk performance metrics, tickets by type provide a digestible visual snapshot of the main requests handled by agents over a given time period.
Service request tickets– when the ticket contains an enquiry about a product or service.
Incident– unplanned interruption or reduction in the service quality of the product.
Problem– internally raised by agent who discovers the existence of a problem.
Change request– any change, modification, or replacement of the service or product.
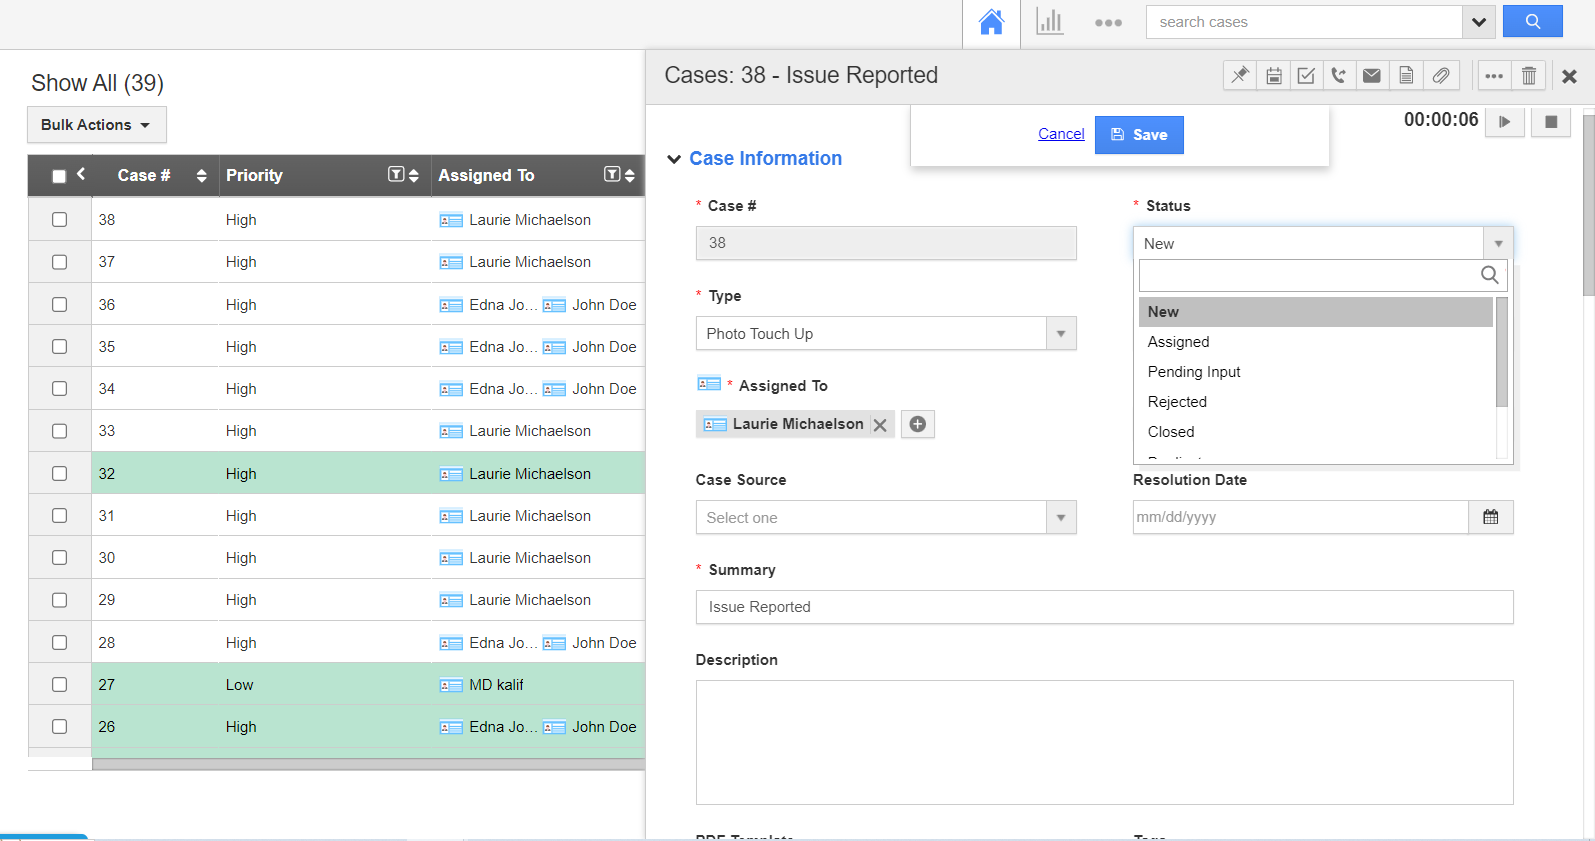
Tickets by status
It refers to the segregation of tickets with respect to their status- solved, open, on hold, closed, reopened, deleted, unassigned, escalated or spam. When businesses are capable of checking tickets on the basis of their status, it is possible to track the overall performance and responsiveness of the customer service operations.
 |
Open tickets ongoing cases that need to be handled by the agents.
Solved tickets that are resolved. In addition, solved tickets can be reopened and updated and if not closed by a trigger or automation, gets automatically closed after 28 days through a system action.
On-hold tickets that cannot be resolved at this moment. For instance, when other departments are involved.
Closed tickets are locked and should not be closed manually but done only through a trigger or automation. Moreover, they cannot be updated or reopened unlike solved tickets. Further, it is moved to archived status after a time frame of 120 days.
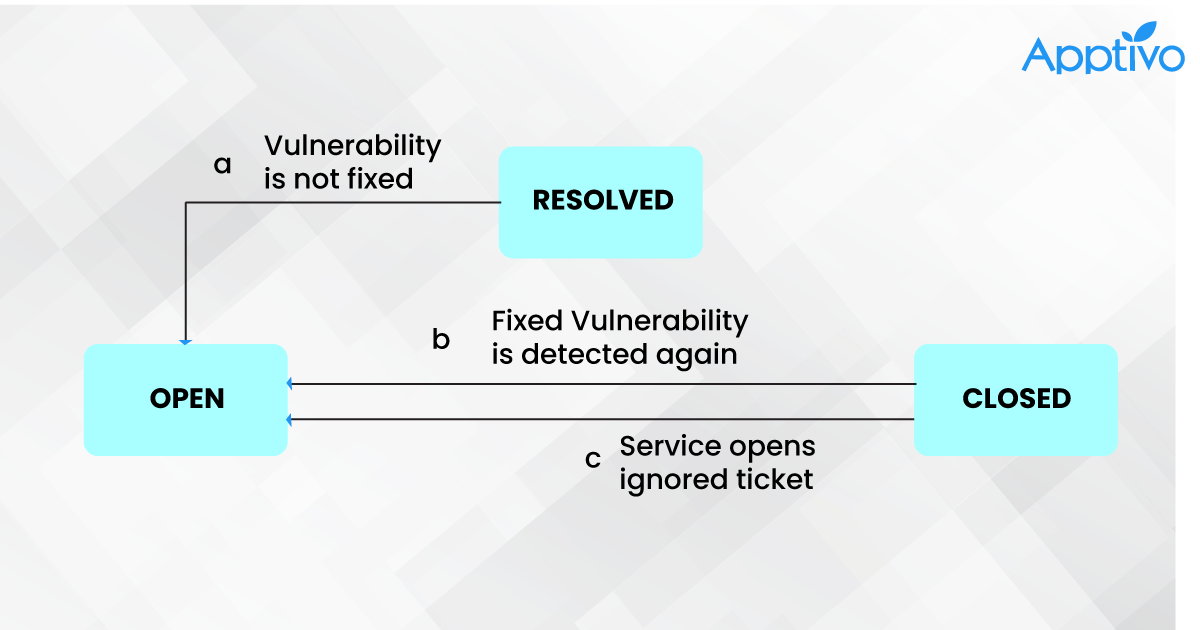
Reopened tickets are those who were previously resolved or closed.
It can be reopened in the following instances-
i) If a user marks a ticket as Resolved and the corresponding vulnerability is discovered during the next scan, the ticket is automatically reopened.
ii) If a ticket is marked as Closed/Fixed by the service and the related vulnerability is discovered during the next scan, the ticket is reopened.
iii) If a ticket is marked as Closed/Ignored, the agent can reopen it at any time by editing the ticket. You can also have Closed/Ignored tickets automatically reopened at a predetermined time.
 |
Unassigned tickets are those who are not assigned to any particular agent either manually or automatically.
Escalated tickets are those who are redirected to a higher level of agent or manager in order to resolve the issue.
Spam tickets are categories when they tend to be of malicious nature.
However, depending on the company’s policy, each status may have a different connotation, and those listed here are just examples.
Tickets by channel
Tracking tickets by channel in help desk metrics is like putting one’s ear to the ground to hear what their customers are saying. By doing so, businesses can get a feel for which channels customers prefer to use when seeking support, and identify any areas where they might be falling short in terms of customer experience. Armed with this knowledge, brands can put their best foot forward and deliver exceptional support that leaves customers singing their praises. After all, the squeaky wheel gets the grease, so it’s important to keep a close eye on the help desk metrics to make sure businesses meet their customers need.
Top agents
Maintaining employee engagement and motivation is essential for attaining long-term success in customer care. The performance of individual support agents is ranked on a leaderboard, which is a wonderful tool to assist businesses do this. This gives them a bird’s-eye perspective of each team member’s performance, enabling them to commend individuals when appropriate and offer specialized training and support when required. By utilizing this technology, it is possible to build a high-performing team of customer service representatives who operate as a well-oiled machine to provide exceptional customer service.
Repeat incidents
Tracking repeat incidents enables support agents to link incoming tickets related to the same issue, saving them the trouble of registering duplicate incidents in the system. In other words, it’s like connecting the dots and uncovering a pattern that not only streamlines a company’s support process but also frees up their agents’ time to focus on other pressing issues. This means that the support team can deliver exceptional service to their customers without duplicating efforts. When the functioning is seamless, then the outcome of clients being delighted is clear leaving agents work stress-free.
Repeat visits
A repeat visit is one in which a customer keeps returning with the same issue. Monitoring these visits can be a game-changer since it enables companies to tackle the issue before it becomes a pain in the neck. Companies can prevent running into the same problem twice by producing appropriate reports and assessments.
Tickets completed
Comparing closed and open tickets is a great way to evaluate the effectiveness of any company’s customer care team while also accomplishing two goals at once. It’s comparable to keeping an eye on the quantity and quality of the team’s output. If there is a difference between the two, it is a warning sign that something is off. That can mean that the group requires more assistance, greater instruction, or work-load automation.
Tickets by hour
In simple terms the metrics of tickets per hour and customer support agent’s productivity are measured. It’s an effective way to measure how well they’re addressing every customer’s enquiries and check for whether further help is needed. In essence, it contributes to making sure that the customer service system is running smoothly and satisfying customers.
Number of tickets
By cutting down the number of tickets generated, businesses can kill two birds with one stone: saving on support costs and time. The number of tickets created may be a red flag, pointing out areas where the customer experience is weak.
Backlogs
Having a backlog of unanswered emails is a sign of a problem. It’s similar to attempting to fit a square peg into a round hole. It’s a good idea to have a backup plan in place in case the backup plan doesn’t work out. Backlogs can occasionally be brought on by ineffective ticket handling, such as when representatives complete a ticket but fail to close it. Automated processes and chatbots may be a real lifesaver in these situations, expertly routing inquiries to find the best possible resolution for the consumer while freeing up crucial time and flexibility for harried support workers. It’s like having an extra set of hands to contribute when businesses most need it!
Summary
The success of any firm depends on offering outstanding customer service. However, success of your company will depend on your capacity to respond to client issues quickly, empathetically, and personally across all channels.
You cannot afford to overlook your customer service department because it is the motor that propels your company forward. You may grow your business to heights you never imagined imaginable by using the ideal combination of KPIs and metrics to track service desk activities, as well as current support desk metrics dashboards and business intelligence software.
Latest Blogs

Role Of CRM In Travel And Tourism Industry
Travel and tourism have been a significant part of everyone’s life since the ancient period. When we skim through the pages of history, It should be noted that humans were initially nomads before they became settled in one place. They...
Read more →
WHAT IS CRM TECHNOLOGY?
Introduction CRM is a technology that helps manage the entire customer information and interactions in order to build and maintain superior customer relationships. The CRM solution replaces spreadsheets and other different applications, which makes it easy for the businesses to...
Read more →
Everything you need to know about the Annual Maintenance Contract!
1. What is an Annual Maintenance Contract? 2. Benefits of Maintenance Contracts 3. How can Apptivo CRM help you manage maintenance agreements and vendors? 4. Summary Think about getting the confidence that the machinery is well-maintained and performing optimally, without...
Read more →